DEVOPSTECHSOFTWARES

Cloud, DevOps and data

Business Intelligence and Analytics for Dashboards, KPIs, Reporting and Better Decisions

Turn scattered operational data into dashboards and reports that help leaders understand sales, finance, customers, operations, inventory, projects and performance.

Business intelligence dashboard for KPIs, reports and operational analytics
BI is useful when dashboards answer real management questions, not when they simply display more charts.
sales, finance, operations, customers and service
KPIs
sources, cleanup, pipelines and validation
Data
management views, drilldowns and alerts
Dashboards
roles, access, training and review rhythm
Adoption

Data turned into management visibility

Business intelligence should help teams decide what to do next

Many companies have data but not clarity. Sales records, finance exports, stock movements, customer interactions and operational logs sit in different systems, while management still relies on manual reports that arrive late or disagree.

Business intelligence work begins by defining the decisions the business needs to make: which KPIs matter, where the data comes from, how often it changes, who should see it and what action should follow.

DevOpsTech Softwares builds dashboards, data pipelines and reporting foundations for businesses that need clearer visibility across sales, finance, operations, inventory, customer service, projects and management performance.

Before committing to a delivery path, it may help to read Business Intelligence Dashboards: From Raw Data to Decisions, Database Design for Business Applications and Data Migration Planning and Validation.

Service at a glance

Best for
Businesses that need better visibility from ERP, CRM, POS, ecommerce, finance, inventory, support or custom systems
Typical outputs
KPI map, data source review, cleaned datasets, dashboards, reports, access rules and analytics improvement plan
Core decisions
Metrics, data sources, definitions, refresh frequency, report users, access levels, dashboard actions and data quality
Integration context
ERP, CRM, accounting, POS, ecommerce, inventory, portals, databases, spreadsheets, APIs and cloud data platforms
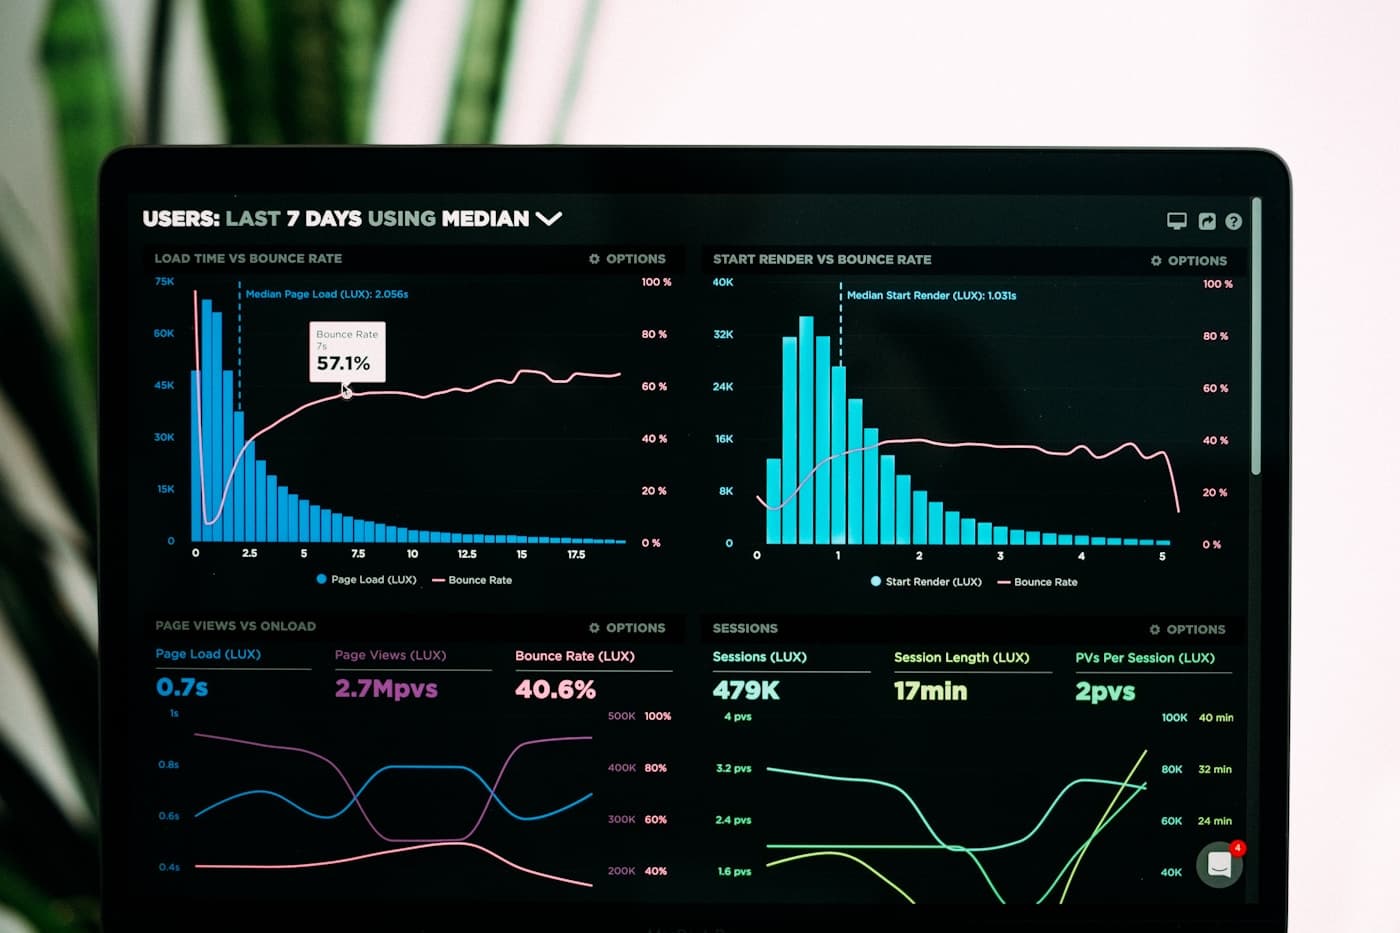
Business intelligence dashboard for KPIs, reports and operational analytics
Good analytics starts with clear KPIs, trustworthy data sources, refresh rules, access control and decisions the dashboard should support.

BI planning decisions

What should be decided before building dashboards

Dashboards are only as useful as the KPI definitions and data quality behind them. We define the business questions first.

AreaWhat we decideWhy it matters
Business questionsRevenue, margins, collections, stock, customer behavior, service performance, project status or operational bottlenecks.Dashboards should answer priority questions rather than collect attractive charts.
KPI definitionsMetric names, formulas, filters, date logic, exclusions, ownership and target values.Teams cannot trust dashboards when the same metric means different things to different departments.
Data sourcesERP, CRM, accounting, POS, ecommerce, spreadsheets, custom databases, APIs, logs or manual imports.Source quality and ownership determine how reliable the dashboard can be.
Data refreshReal-time, hourly, daily, weekly, manual upload, scheduled pipeline or approved reporting close.Not every report needs real-time data, but every report needs a refresh rhythm users understand.
Access and governanceExecutive views, manager views, department views, sensitive fields, exports and user permissions.BI often exposes finance, customer and staff data that should not be visible to everyone.
Action and adoptionWho reviews the dashboard, what decisions it informs, meeting rhythm, alerts and improvement process.Dashboards create value when teams use them to act, not only when they exist.

Capability depth

What this service covers

01

BI discovery and KPI definition

We help define the questions, metrics and reporting views that matter to the business.

  • KPI workshops for sales, finance, operations, inventory, customer service, projects and management.
  • Metric definitions, formulas, filters, date logic, targets and owner decisions.
  • Dashboard scope that separates must-have management visibility from nice-to-have charts.

02

Data source review and cleanup

We inspect the systems and files behind the reports so dashboards are built on usable data.

  • Review of databases, spreadsheets, ERP, CRM, POS, ecommerce, accounting tools and APIs.
  • Data quality checks for duplicates, missing values, inconsistent statuses, dates and references.
  • Cleanup and mapping plans before dashboard development begins.

03

Dashboard and report development

We build dashboards that present KPIs clearly for executives, managers and operational teams.

  • Executive summaries, department dashboards, drilldowns, filters, trend views and exception reports.
  • Reports for sales, collections, stock, customers, projects, service quality and finance operations.
  • Mobile-friendly or management-ready layouts where teams need quick review.

04

Data pipelines and refresh logic

We connect data sources and reporting tables so dashboards can update predictably.

  • Scheduled imports, API pulls, database views, reporting tables, transformation rules and refresh checks.
  • Data validation, failure handling, pipeline logs and ownership notes.
  • Cloud-ready data foundations for growing analytics needs.

05

BI adoption, access and improvement

We help teams use dashboards safely and improve them as business questions mature.

  • Role-based access, sensitive data rules, export controls and dashboard training.
  • Review rhythm for management meetings, department reviews and operational alerts.
  • Continuous improvement as new KPIs, data sources and reporting needs appear.

BI standards

Dashboards should be trusted, focused and tied to decisions

01

Start with decisions

BI work should begin with what leaders need to understand and decide, not with chart selection.

02

Define metrics clearly

Each KPI needs an owner, formula, source, filter logic and refresh expectation.

03

Check data before designing

Data quality issues should be exposed before dashboards create a false sense of accuracy.

04

Make access intentional

Finance, customer, staff and operational data should be visible to the right people only.

Delivery path

A controlled route from scattered data to useful dashboards

01

Define questions, KPIs and users

We clarify the decisions, metrics, dashboard users, access needs, data sources and review rhythm.

02

Review and prepare data

We inspect source data, identify quality issues, define transformations and prepare reporting structures.

03

Build dashboards and validate results

We create dashboards, compare sample metrics to source records, refine filters and verify that users understand the views.

04

Support adoption and improve

We help teams use the dashboards, review feedback, add new metrics and improve data quality over time.

Service FAQs

Questions before BI and analytics work

Can you build dashboards from spreadsheets?

Yes. We can start with spreadsheets, but we also review data quality and recommend cleaner sources when the reporting process needs to become more reliable.

Can dashboards combine data from several systems?

Yes. We can combine data from databases, ERP, CRM, POS, ecommerce, accounting tools, APIs and spreadsheets when source access and field mapping are clear.

Do dashboards need real-time data?

Not always. Some dashboards need real-time updates, while others are better refreshed daily or weekly. We choose the refresh rhythm based on the decision the dashboard supports.

Need dashboards that leaders can actually trust?

Tell us what decisions your team needs to make and where the data lives today. We will help turn it into clearer reporting.