DEVOPSTECHSOFTWARES

Product UI/UX design

Dashboard and Admin Panel UX for Metrics, Tables, Reports, Approvals and Operational Control

Design dashboards and admin panels that help teams understand status, manage records, approve work, find problems and take action without confusion.

Dashboard and admin panel UX design for metrics reports tables approvals and operational controls
A dashboard should not only display numbers. It should help users know what changed, what matters, what is risky and what action to take next.
KPIs, trends, alerts, drill-downs and summaries
Metrics
tables, filters, search, details and bulk actions
Records
roles, approvals, status changes and audit trails
Control
states, components, specs and build review
Handoff

UX for operational control

Dashboards and admin panels should help teams act, not just look at data

Many dashboards fail because they are treated like decorative chart pages. Real operational dashboards have a harder job: they must help users scan status, compare performance, find exceptions, open records, approve work, export data, investigate trends and take the right next action.

Admin panels also carry risk. A poorly designed admin screen can lead to wrong status changes, accidental deletions, weak permission control, missed approvals, duplicate work, slow support and teams that avoid using the software because it feels unsafe or confusing.

DevOpsTech Softwares designs dashboard and admin panel UX for SaaS products, portals, ERP modules, CRM systems, reporting tools, customer support systems, finance workflows, inventory systems and custom business applications. We focus on decision-ready information, dense but readable layouts, table usability, role-aware controls, clear states and developer-ready handoff.

Before committing to a delivery path, it may help to read Dashboard and Admin-Panel UX Best Practices, Design Systems for Scalable Software Products and UX Audit: What It Examines and Changes It Produces.

Service at a glance

Best for
Admin panels, business dashboards, ERP modules, CRM dashboards, SaaS back offices, reporting portals and internal operations systems
Typical outputs
Dashboard layouts, admin workflows, table UX, reporting screens, role-based controls, high-fidelity UI, component patterns and handoff notes
Core decisions
Metrics, data hierarchy, filters, status states, approval actions, permissions, exports, alerts, empty states and error handling
Integration context
Web apps, SaaS platforms, ERP, CRM, BI dashboards, helpdesk systems, e-commerce back offices and custom business software
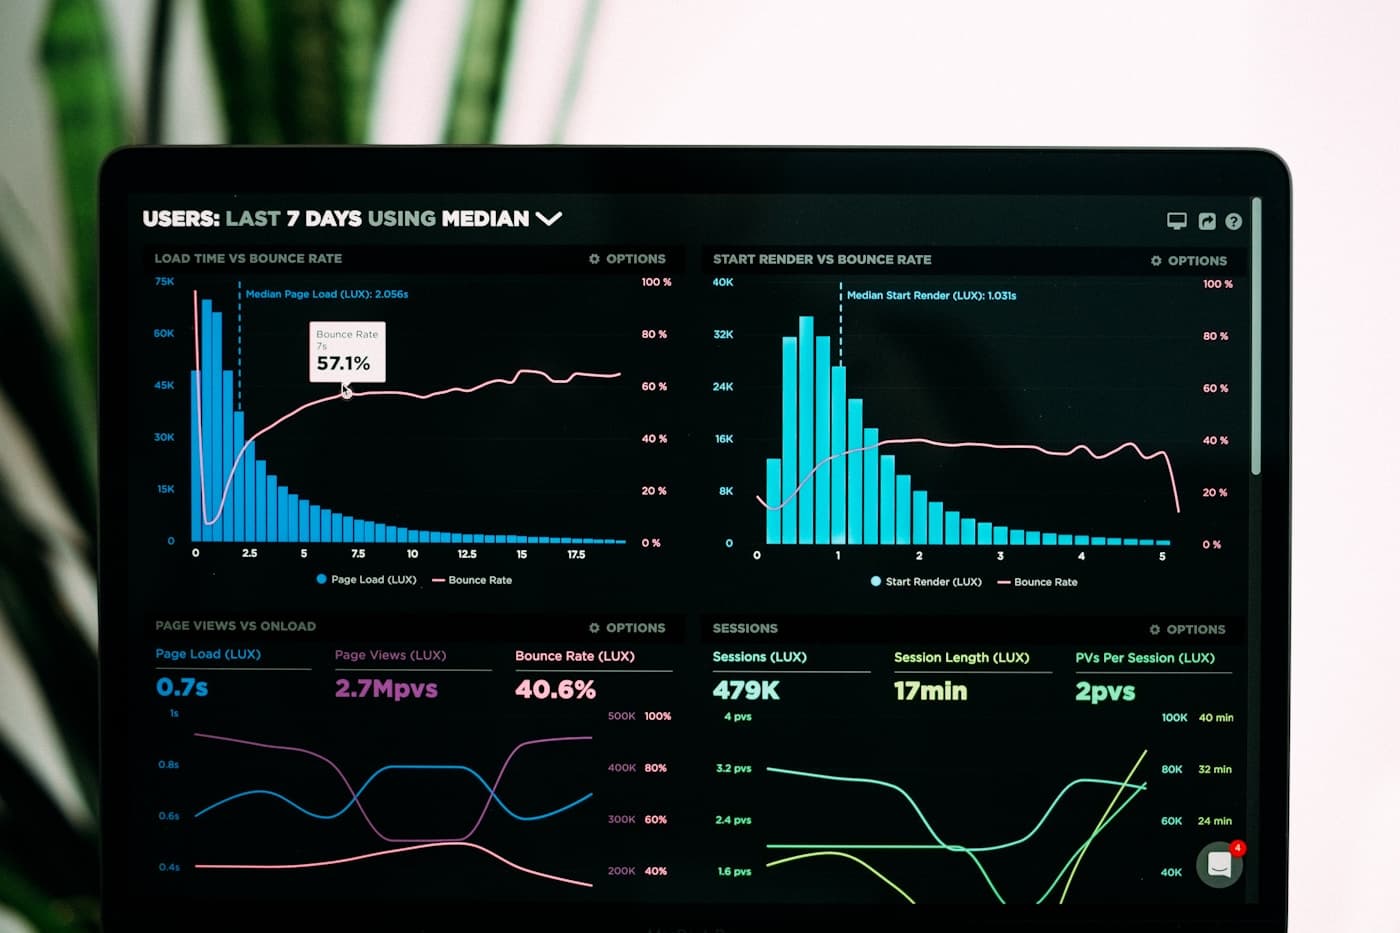
Dashboard and admin panel UX design for metrics reports tables approvals and operational controls
Good admin UX brings order to dense data, roles, filters, status changes, approvals, reports and actions that teams use every day.

Dashboard decisions

What dashboard and admin panel UX should define before frontend work

The interface should make operational work easier to understand and safer to perform. We clarify data hierarchy, actions, permissions and states before implementation.

AreaWhat we decideWhy it matters
User responsibilityExecutive, manager, operations, finance, support, sales, admin, viewer and restricted user needs.Different users need different metrics, shortcuts, approvals and levels of detail.
Metric hierarchyPrimary KPIs, secondary metrics, comparisons, date ranges, charts, alerts and drill-down paths.A dashboard should tell users what deserves attention instead of presenting every number with equal weight.
Table and record UXFilters, search, sorting, pagination, saved views, row actions, bulk actions, exports and detail pages.Most admin work happens in tables and records, so table UX has a direct effect on daily productivity.
Action safetyApprovals, status changes, delete actions, reversals, confirmation modals, warnings and audit history.Admin users need confidence that important actions are intentional, reversible where possible and traceable.
Permission clarityRole-based visibility, disabled actions, access messages, ownership rules and sensitive data treatment.Users should understand what they can do, what they cannot do and when they need authorization.
Report readinessExport formats, printable views, scheduled reports, filters, summaries and empty or delayed data states.Dashboards often feed management decisions, so reporting behavior must be planned beyond the screen layout.

Capability depth

What this service covers

01

Dashboard strategy and metric hierarchy

We define what the dashboard should help users decide, then design layouts around attention, comparison and action.

  • KPI grouping, trend summaries, status cards, alerts, charts, date ranges, comparisons and drill-downs.
  • Executive dashboards, operations dashboards, finance summaries, sales reports and support performance views.
  • Metric labels, context notes, data freshness messages and empty states that help users interpret results.
  • Dashboard flows that connect numbers to useful actions instead of leaving users to guess what to do next.

02

Admin panel navigation and workspace design

We organize admin work so users can move between dashboards, records, settings, reports and support actions with less friction.

  • Sidebar, top navigation, tabs, breadcrumbs, search, shortcuts, settings and account areas.
  • Role-specific menus for admins, managers, staff, support agents, finance teams and restricted users.
  • Workspace grouping that separates daily operations from sensitive configuration areas.
  • Responsive behavior for tablets or smaller screens when admin workflows require mobility.

03

Tables, filters and record management UX

We design the record-heavy screens where admin users spend most of their time.

  • Tables with filtering, search, sorting, pagination, saved views, status chips, row actions and bulk actions.
  • Detail pages, edit screens, comments, attachments, history, ownership, approvals and audit trails.
  • Exports, report downloads, printable views, import feedback and validation summaries.
  • Empty, loading, error, permission-limited and no-results states so users understand what happened.

04

Approval, status and control workflows

We design sensitive admin actions so users can approve, reject, assign, close, reverse or escalate work safely.

  • Review queues, approval steps, status transitions, reason fields, confirmations and notifications.
  • Warning messages, irreversible action handling, undo where appropriate and audit trail visibility.
  • Bulk action safeguards for updates that affect many records or customers.
  • Escalation paths and support notes when a user cannot complete an action alone.

05

Reporting and analytics interface design

We design reports that support scanning, filtering, comparison and export without overwhelming users.

  • Report landing pages, summary panels, charts, date filters, comparison selectors and saved reports.
  • User-friendly labels for data categories, statuses, totals, exceptions and calculations.
  • Export flows, scheduled report settings, printable layouts and data delay messages.
  • Layouts that keep dense information readable for managers and operational teams.

06

Dashboard components and developer handoff

We prepare reusable dashboard and admin patterns so the interface stays consistent as features grow.

  • Component patterns for tables, filters, cards, charts, tabs, modals, alerts, badges, forms and action bars.
  • States for loading, empty, error, success, warning, disabled, selected, pending and permission-limited screens.
  • Specs for responsive behavior, chart states, table behavior, form validation and admin actions.
  • Design QA support to catch layout drift, unclear controls and missing states during implementation.

Dashboard UX standards

Dashboard and admin UX should make complex work easier to scan and safer to control

01

Lead with decisions

Charts and metrics should be arranged around what users need to decide, investigate or act on.

02

Make dense screens readable

Tables, filters, cards and forms can be dense, but spacing, hierarchy and labels must still support quick scanning.

03

Protect risky actions

Approvals, deletions, role changes, financial actions and bulk updates need clear confirmations, warnings and history.

04

Design every state

Admin panels need loading, empty, error, permission, delayed data and success states because teams rely on these screens for daily work.

Delivery path

A controlled route from data needs to usable dashboard and admin UX

01

Understand decisions, roles and records

We review user roles, key metrics, operational tasks, records, reports, approvals, permission needs and business risks before designing screens.

02

Structure dashboards, tables and workflows

We map dashboard sections, table behavior, record pages, filters, reports, admin actions, approval flows and state requirements.

03

Design UI screens and reusable patterns

We create high-fidelity dashboards, admin screens, table layouts, forms, controls, alerts, responsive behavior and component patterns.

04

Handoff and review implementation

We prepare specs, assets, states and acceptance criteria, then support development review so the built dashboard remains clear and usable.

Service FAQs

Questions before dashboard and admin panel UX

Can you design dashboards with charts and reports?

Yes. We design KPI dashboards, reporting screens, chart layouts, filters, drill-downs, export flows and data interpretation states.

Can you improve an existing admin panel?

Yes. We can audit current admin workflows, redesign weak screens, improve tables and filters, clarify permissions and create reusable patterns.

Do you design complex tables and bulk actions?

Yes. We design tables with search, filters, saved views, pagination, row actions, bulk actions, exports, status tags and error states.

Need dashboards and admin screens your team can trust daily?

Tell us the records, metrics, reports and admin workflows you need to manage. We will help turn them into clear screens and developer-ready UX.